A few weeks ago I introduced an issue I was working on with a customer who was reporting intermittent issues connecting to Windows Virtual Desktop from the RD Client on their corporate devices, you can read that initial post here.
The focus of that post was doing some preliminary checks, namely comparing connectivity from the RD Client against the Web Interface at the time the user was reporting the issue, this would help narrow down whether the problem was environmental, as in, within the boundary of the users’ device, the customer VPN etc as a successful connection from the web interface would go some way to proving the health of WVD control plane, host pool and session host.
A quick recap on activities and results since that initial post…
Tests confirmed that the user could indeed connect using the web interface at the exact same time the RD Client would not connect, note the user in question was no longer working from home at the time, he was in the corporate office connected to their LAN.
Also note that at the time the user could not connect I confirmed that other users were connected to the same WVD resource, and I myself could connect using the RD Client.
We then worked with the customers’ network and security engineer (who maintains their Cisco Umbrella deployment) to systematically walk through the network topology to ensure traffic from that source IP was successfully traversing each node without error.
We also used WireShark to capture traffic from the users’ device, however, I’ll save that particular deep-dive for a follow-up post as I’m still analysing the results. What I’m hoping to do is compare the resultant capture with the WVD connectivity flow (from part 1) and correlate each step to a particular selection of the capture to hopefully show which step is having problems – this is still work in progress.
The below is an example WireShark capture I used with the customer as a comparison, I started the capture and then opened the RD Client, as mentioned in part 1 the RD Client will always refresh your subscriptions on start-up, this is shown from line 203 to 205 in which the initial connection is made after the RDWEB.WVD.MICROSOFT.COM hostname is resolved in DNS, from line 206 a secure connection is initiated to the WVD control plane which validates the TLS certificate against the GlobalSign certificate authority at line 217 to 221, this is one of the reasons internet access is required for WVD as the certificate authority is accessed from its public endpoint.

I’m hoping to have this analysis and deep-dive completed soon, I’ll document it in a follow-up post after I’ve had it reviewed for and verified for accuracy by the WVD Community and Microsoft WVD Global Black Belts.
Back to the troubleshooting…
Frustratingly during the analysis of traffic logs on the customers’ perimeter firewall and having made zero changes the RD Client was then able to connect to WVD!
This now has us, me and the customers tech team, scratching our heads – are we now looking for something dynamic in an otherwise static local architecture that under certain conditions cause these connectivity problems, such as asymmetric routing? Again, more on that in a later post as I’m working with the customer and their other supporting partners to build a diagram of their holistic network architecture.
After a productive conversation with the customers’ aligned Microsoft DSE it was agreed that whilst we wait for the issue to reoccur we would configure the WVD tenant to send logs to an Azure Log Analytics workspace to see if that could shed any light on the situation.
Setting up a new Log Analytics Workspace is very straight forward, from the search bar in the Azure Portal enter Log Analytics, from the results select Log Analytics Workspaces.

Select Add.

Select an appropriate Subscription and Resource Group, then provide a suitable name for the Workspace and a region to host it, ideally use the same region as the WVD session hosts are deployed.
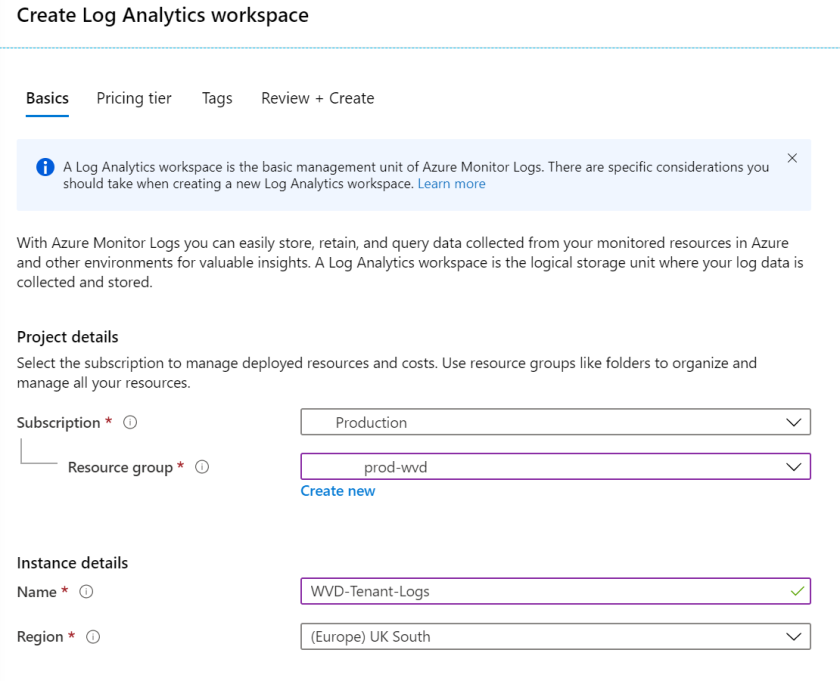
Click ‘Next: Pricing Tier’ to proceed.
Select a pricing tier, details on pricing tiers can be found here.

Proceed through the next two options entering appropriate tags and finally review and create to create the Log Analytics workspace.
Once created the Log Analytics workspace will display a Workspace ID, note this down as you’ll need it later.
Note, the next steps to connect the WVD tenant apply to the Fall 2019 release only, the setup for Spring 2020 release differs.
Binding your WVD tenant quick and straight forward following this Microsoft article.
Before you start you’ll need the below info:
* WVD tenant name
* Azure subscription ID
* Log Analytics Workspace ID (available from Overview pane on the workspace itself)
* Log Analytics Primary Key (available from Advanced Settings > Connected Sources)
Once you have the above open PowerShell and run the below commands:
Add-RdsAccount -DeploymentUrl https://rdbroker.wvd.microsoft.com
Set-RdsTenant -Name  -AzureSubscriptionId  -LogAnalyticsWorkspaceId  -LogAnalyticsPrimaryKey
This will bind your WVD tenant to the Log Analytics workspace.
Be aware it can take up to an hour before log data will start to appear so be patient.
Note, connecting the WVD tenant to the Log Analytics Workspace will send log data at the tenant only, such as user-driven connection events, it will not send VM or guest OS performance stats, for that you must install the Windows Agent on the VM following this article.
WVD creates the three below custom logs in the workspace.

Like any log managment solution the key is often knowing what you’re looking for and how to find it, Log Analytics is no different, Microsoft provides two great example queries to get you started, here.
To query the workspace select Logs under General, this will open a new pane for the query editor.
I adapted one Microsoft’s example queries to show just failed connections from the RD Client where ClientType_s == “com.microsoft.rdc.windows.msrdc.x64” denotes connections from the RD Client, see below:
WVDActivityV1_CL

| where Type_s == "Connection"

| where Outcome_s == "Failure"

| where ClientType_s == "com.microsoft.rdc.windows.msrdc.x64"

| join kind=leftouter

(

WVDErrorV1_CL

| summarize Errors = makelist(pack('Time', Time_t, 'Code', ErrorCode_s , 'CodeSymbolic', ErrorCodeSymbolic_s, 'Message', ErrorMessage_s, 'ReportedBy', ReportedBy_s , 'Internal', ErrorInternal_s )) by ActivityId_g

)

on $left.Id_g  == $right.ActivityId_g

| join  kind=leftouter

(

WVDCheckpointV1_CL

| summarize Checkpoints = makelist(pack('Time', Time_t, 'ReportedBy', ReportedBy_s, 'Name', Name_s, 'Parameters', Parameters_s) ) by ActivityId_g

)

on $left.Id_g  == $right.ActivityId_g

|project-away ActivityId_g, ActivityId_g1
Select a time range, highlight the entire query (Control+A) and click Run.
The results will be displayed as below, this shows two failed attempts from the RD Client in the past 24 hours, this also shows the user is running Windows 10 build 1809 (11763) and version 1.2.945.0 of the RD Client – both extremely useful pieces of the information when analysing data and looking for trends.
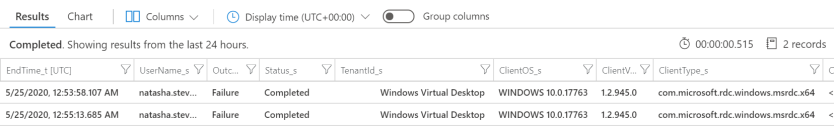
Drilling down into each of those failed connections though is where the gold is!
From the left-most side of each log is an arrow to expand, the first tier provides a summary of the connection.

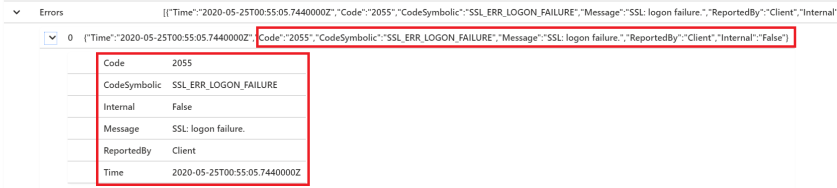
Afterwhich is a subset of the log displaying any errors, you can see from the below that this session failed with error code 2055, SSL_ERR_LOGON_FAILURE.
Now, I’m not going to profess to know exactly what that particular error is caused by but it is certainly enough to either focus and further troubleshooting or raise a support request with Microsoft.
Lastly, the final hive in the log in extremely interesting in that it walks you through the checkpoints of the connection flow, you can view the result of each checkpoint.

If you’re interested in engaging more with others using and learning more about WVD please consider following the WVD Community on Twitter and joining the Slack channel, both ran by Neil and Stefan, and both great sources of info!
Thanks.

Hello,
We are having the same problems. Did you manage to resolve this with Microsoft support? We have tried it but we have not had a satisfactory answer.
LikeLike